Most small stores have analytics installed and almost none of them use it. The dashboard gets opened after a bad month, somebody looks at a line going down, and the meeting ends with a decision that would have been made anyway.
That is not a failure of the tool. GA4 will answer a lot of useful questions. It just will not tell you what to do, and it is unusually bad at volunteering the three or four numbers that actually matter to a store doing modest traffic.
Small numbers behave differently
The first thing to accept is that on a few thousand sessions a month, most of what the interface shows is noise wearing a percentage sign.
A conversion rate that moves from 1.8% to 2.3% on eleven hundred sessions is four extra orders. That is a good week, not a trend, and treating it as a trend leads to changing things that were working. The same applies in reverse: a bad fortnight is usually a bad fortnight.
So the practical discipline is to look at longer windows than feels natural — rolling twenty-eight days minimum, and month-over-month rather than week-over-week — and to stop comparing a Tuesday to a Tuesday.
Four numbers, and the rest is context
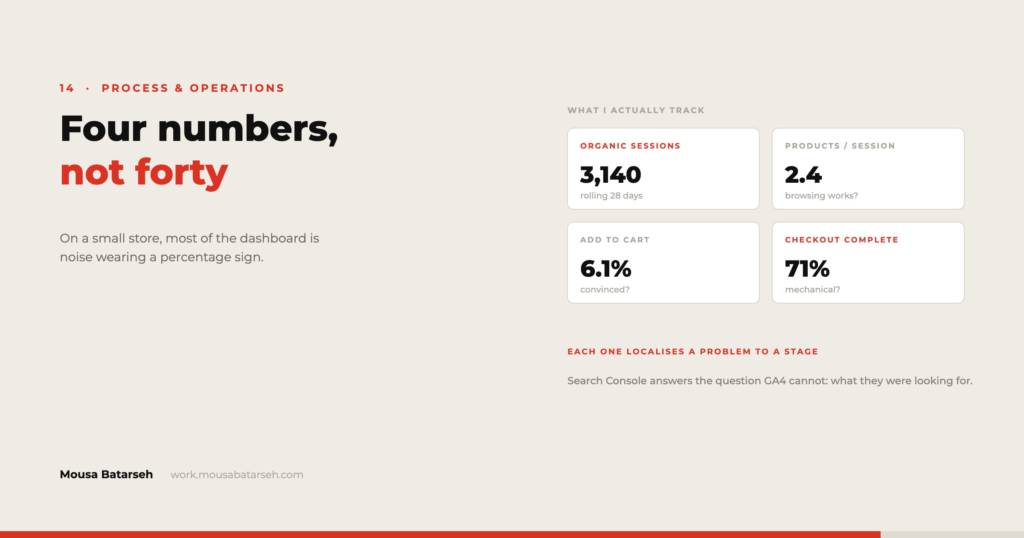
For a small store I track four things and treat everything else as diagnostic detail to be consulted when one of the four moves.
- Sessions from organic search, because that is the channel that compounds and the one the catalogue work is meant to affect.
- Product page views per session, which is the honest measure of whether browsing works. A store where people see one product and leave has a navigation problem, not a traffic problem.
- Add-to-cart rate on product pages, which separates “people cannot find things” from “people find things and are not convinced.”
- Checkout completion, because a drop here is almost always mechanical — a shipping surprise, a payment failure, a form that breaks on one browser — and mechanical problems are fixable in a day.
Those four localise a problem to a stage. That is all a metric can honestly do; the reason still has to be found by looking at the pages.
Search Console answers the question GA4 cannot
GA4 tells you how many people arrived from search. Search Console tells you what they were looking for, which is far more actionable and consistently ignored.
The report I open most is queries with impressions but a low click rate. Those are pages that rank, get seen, and do not get chosen — which is a title and description problem, and it is fixable in twenty minutes per page with no development work at all.
The second is queries where the landing page is wrong — a category ranking for something a specific product should own. That is usually an internal linking issue and it points at a structural fix rather than a content one. Both of those reports do more for a small store than any dashboard.
Set up events for the two or three things that matter
Enhanced measurement will happily record scrolls and outbound clicks forever, and none of it will change a decision.
What is worth the setup is the handful of interactions that indicate intent on your particular store. A filter being used. A size guide being opened. A “request a quote” form being started but not submitted. On a wholesale site, an account application beginning.
Three well-chosen events beat forty automatic ones, because each of them maps to a decision somebody could actually take next week.
The report I actually send
A monthly note, one page, four numbers with the previous month beside them, and two sentences about what changed and why I think so. No screenshots of line charts.
The value is not in the numbers — it is in the sentence explaining them, because that is the part that requires having looked. A dashboard link puts the interpretation back on the client, and the interpretation is the work. This is the same argument as the last step of the eleven-step workflow: measurement without interpretation is a step that got compressed.
What this is really about
Analytics on a small store is not about knowing more. It is about knowing which stage is failing, so that effort goes to the right place rather than to whatever was most recently discussed.
Four numbers, two Search Console reports, three events, and a monthly paragraph. That is a complete measurement practice for most stores, and it takes less time to maintain than the dashboard nobody opens.